Walk through a supermarket and try a simple experiment.
Pick up a bag of frozen spinach. Then pick up a protein bar wrapped in glossy packaging promising clean ingredients and natural energy.
Now ask yourself a common piece of nutrition advice:
Which one is processed?

Technically, the answer is both.
The spinach was washed, chopped, and frozen.
The protein bar was mixed, compressed, flavored, and preserved.
Yet most of us instinctively feel these foods belong in completely different categories. And that instinct is pointing at something real.
The problem is that the label meant to guide us — processed food — collapses those differences into a single vague warning.
“Try to avoid processed food.”
It sounds sensible. Responsible, even. But the moment many people try to apply it, the clarity starts to fade.
Is yogurt processed?
What about bread? Olive oil? Frozen vegetables?
These questions come up surprisingly quickly once you start thinking about it.
And when a label creates more confusion than guidance, it’s worth slowing down and asking a deeper question:
What does “processed” actually mean?
The Problem With the Word “Processed”
In the simplest sense, processed just means food has been changed in some way. Washing, grinding, fermenting, heating, freezing. By that definition, almost everything humans eat is processed to some degree.1
Over time, though, the word quietly picked up a moral undertone. Processed stopped describing a transformation and started implying a judgment: processed meant unhealthy.1
That subtle shift erased some important distinctions.
Freezing vegetables to preserve nutrients is processing.
So is engineering a snack designed to dissolve quickly on the tongue, spike blood sugar, and encourage one more handful.
Same word. Very different biological outcomes.
When words lose precision, the advice built on them often becomes blunt. And blunt advice tends to create more noise than clarity.
NOVA: A More Useful Framework
Because this confusion kept appearing in nutrition discussions, researchers developed the NOVA food classification system, which groups foods based on how and why they are processed.1
The insight behind NOVA is refreshingly simple.
The question isn’t whether food is processed.
The question is what the processing was designed to do.
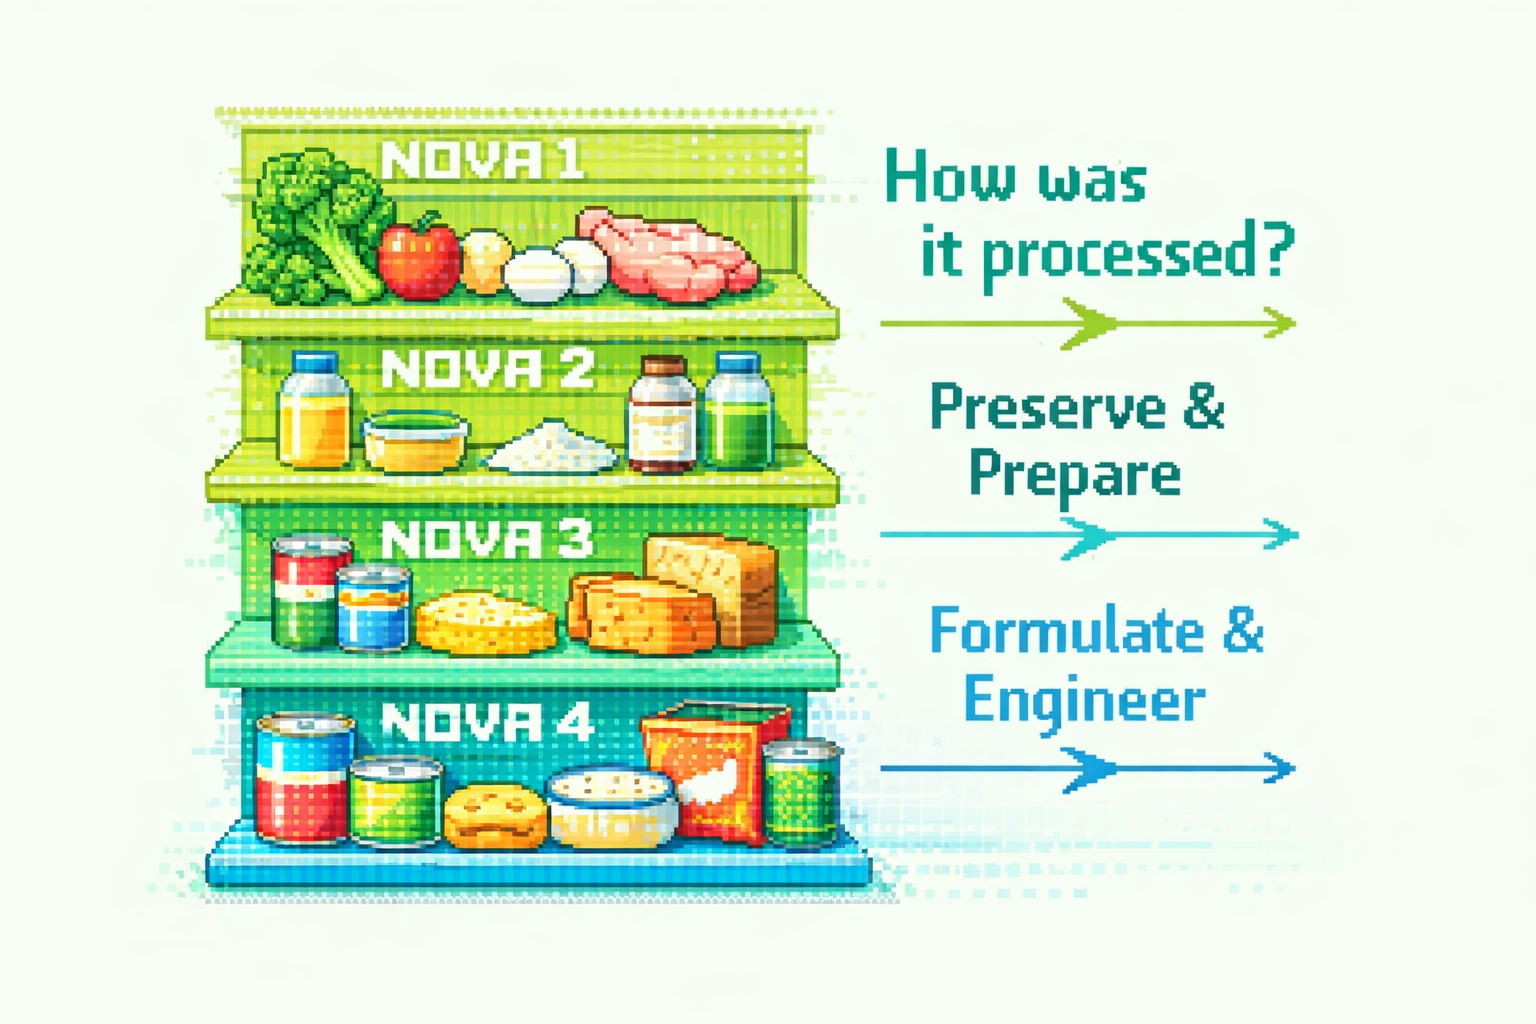
NOVA divides foods into four broad groups.
NOVA 1 — Unprocessed or minimally processed foods
Foods close to their natural state or altered only to preserve or prepare them.
Examples include fruits and vegetables, eggs, legumes, plain yogurt, and frozen produce.1
NOVA 2 — Processed culinary ingredients
Substances extracted from foods or nature and used in cooking.
Oils, sugar, honey, and salt fall into this category.1
NOVA 3 — Processed foods
Foods made by adding culinary ingredients to minimally processed foods.
Bread, cheese, canned beans, and fermented vegetables are typical examples.1
Many of these foods come from preservation or cooking traditions developed long before modern food manufacturing.
NOVA 4 — Ultra-processed foods
Industrial formulations made largely from refined ingredients and additives designed to enhance taste, texture, shelf life, and convenience.1
Many packaged snacks, sugary drinks, and ready-to-eat meals fall into this category.
The distinction isn’t really about the number of steps involved.
It’s about the intent.
Why NOVA Matters
One reason researchers began using NOVA is that people kept noticing a puzzling pattern: two foods that looked very similar on a nutrition label could behave quite differently in the body.
In a controlled study at the National Institutes of Health, researchers designed ultra-processed and minimally processed diets to look similar on paper, with comparable calories and nutrients. But when participants were allowed to eat freely, those on the ultra-processed diet consumed more calories and gained more weight.2
In other words, the difference wasn’t simply the nutrients listed on the label.
It was the structure of the food itself.
The nutrients were similar.
The eating behavior was not.
Large population studies show a similar pattern. Higher intake of ultra-processed foods is associated with increased risk of obesity, heart disease, and other chronic conditions.3,4
This doesn’t mean all processing is harmful.1
Instead, the evidence points to a more specific pattern: industrial ultra-processing designed for convenience and hyper-palatability can disrupt appetite regulation and energy balance.2,4
That’s a much more precise claim than simply saying “processed food is bad.”

The Illusion of Certainty on Food Labels
This is where food labels can sometimes make things even more confusing.
Terms like low calorie, high protein, or net carbs sound precise. But they describe food on a package, not food interacting with a living biological system.
Digestion isn’t simple arithmetic.
Energy availability depends on food structure, digestion speed, hormones, and individual biology. Two foods with the same calorie label can produce very different hunger and energy responses.2
Yet when the label and the body disagree, many people are taught to trust the label — and doubt themselves.
That isn’t a personal failure.
It’s what happens when the framework itself is incomplete.
“Net Carbs” and the Arithmetic Illusion
Take the idea of net carbohydrates, which suggests some carbohydrates “don’t count.”
In reality, digestion rarely behaves like a subtraction equation.
Fiber, resistant starch, and individual metabolism all influence how carbohydrates are processed.5
Two foods with the same “net carb” number can behave differently in the body.
What matters most isn’t the label.
It’s the metabolic response.
Glycaemic Index: Useful but Incomplete
The glycaemic index (GI) ranks carbohydrates by how quickly they raise blood sugar.6
But it is measured using single foods eaten in isolation after an overnight fast.
Real meals are more complex.
Protein, fat, fiber, cooking methods, and food order can all change the glucose response.7
Cooling rice alters starch structure.
Freezing and toasting bread can change its impact on blood sugar.
Eating vegetables or protein before carbohydrates can soften the glucose rise.
Same food. Different context. Different signal.
GI is a helpful tool.
It just isn’t the whole story.
Signal Versus Noise
In the Inner Youth Cycle™, signal refers to the body’s feedback.
How long energy lasts.
When hunger returns.
Whether cravings feel calm or urgent.
These aren’t moral judgments. They’re biological signals.
When we rely only on labels and numbers, we replace that feedback with rules. The signal doesn’t disappear.
It simply becomes harder to hear.
What You Can Do Instead
Most people don’t need stricter food rules.
What tends to help more is clearer information.
Start by noticing what happens after you eat, not with scrutiny but with curiosity.
How long does energy last?
When does hunger return?
Does the meal feel stabilizing or agitating?
Then zoom out from the label and consider purpose.
Was the food processed to preserve, prepare, or nourish?
Or was it engineered to be fast, frictionless, and difficult to stop eating?
This isn’t about perfect choices.
It’s about understanding cause and effect.
The Real Question
“Processed food” was never the real problem.
The lack of distinction was.
A more useful question isn’t:
Is this processed?
It’s something more revealing:
How was it processed, and what happens in my body afterward?
That’s usually where clarity begins.
Everything else is just packaging.
References
1. Monteiro CA et al. (2019). Ultra-processed foods: what they are and how to identify them. Public Health Nutr. PMID: 30744710
2. Hall KD et al. (2019). Ultra-processed diets cause excess calorie intake and weight gain. Cell Metabolism. PMID: 31105044
3. Srour B et al. (2019). Ultra-processed food intake and cardiovascular risk. JAMA Internal Medicine. PMID: 31142457
4. Lane MM et al. (2021). Ultra-processed food and chronic disease: systematic review. Obesity Reviews. PMID: 33167080
5. Englyst HN et al. (1992). Classification of nutritionally important starch fractions. European Journal of Clinical Nutrition. PMID: 1330528
6. Jenkins DJA et al. (1981). Glycemic index of foods. American Journal of Clinical Nutrition. PMID: 6259925
7. Shukla AP et al. (2017). Carbohydrate-last meal pattern and glucose response. BMJ Open Diabetes Research & Care. PMID: 28989726

You must be logged in to post a comment.